Wisely provides insights into how communication channels perform while businesses communicate with customers. You can view and download the reports of your desired channels including WhatsApp, SMS, RCS and Truecaller.
Analytics UI in Wisely consists of two tabs that enable you to assess various insights of channels and identify the gaps to improve the effectiveness of each channel.
You can navigate to the Analytics and Reports module by clicking on the Analytics from the left navigational bar in the Wisely UI. Under Reports, you can click on Performance to view the different tabs available on each channel.
Overview
The overview tab provides the following charts, and each chart contains multiple metrics. You can filter the data by date allowed up to a maximum of 35 days and by business group.
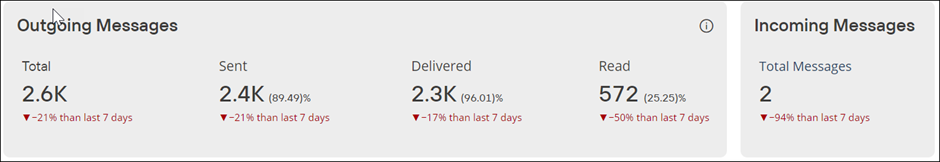
Outgoing and Incoming Messages
This chart contains multiple metrics including total, sent, delivered, read for outgoing messages and total incoming messages received by the Wisely platform.
Metric | Description |
|---|---|
Total | Total number of messages sent from Wisely. |
Sent | Indicates the total number of messages sent to customers successfully out of total messages. |
Delivered | Indicates the total number of messages that reached the customer out of total sent messages. |
Read | Indicates the total number of messages opened by customers out of the total number of delivered messages. |
Total Incoming Messages | Total number of messages received from the customers. |
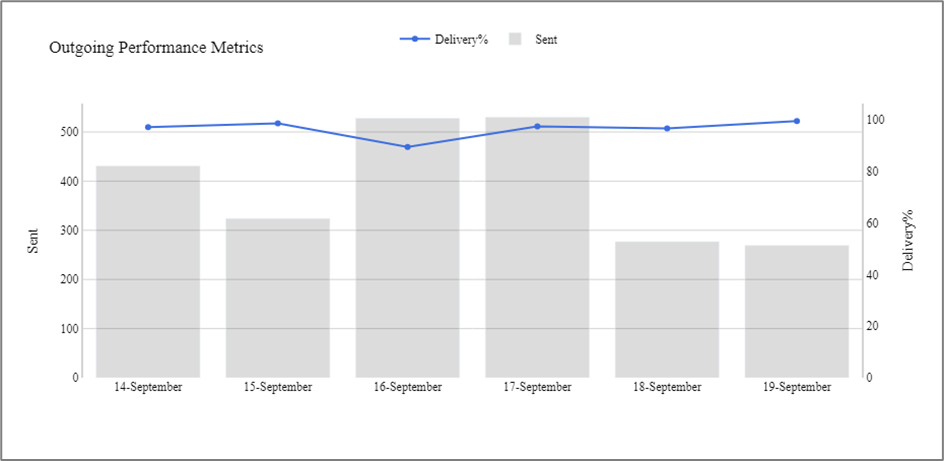
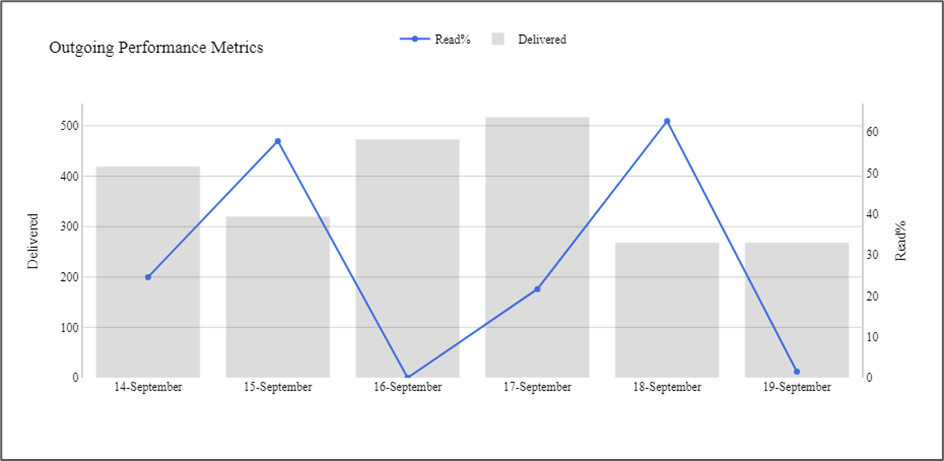
Outgoing Performance Metrics
This chart enables you to see the following metrics and you can magnify each bar to delve into more details within the chart.
Sent vs Delivery%
These metrics provide insights into the total number of messages sent represented by horizontal grey colour bars and the delivery percentage represented by blue lines over several days. When you hover over each bar, you can see the total number of messages sent and the total number of messages delivered per day.
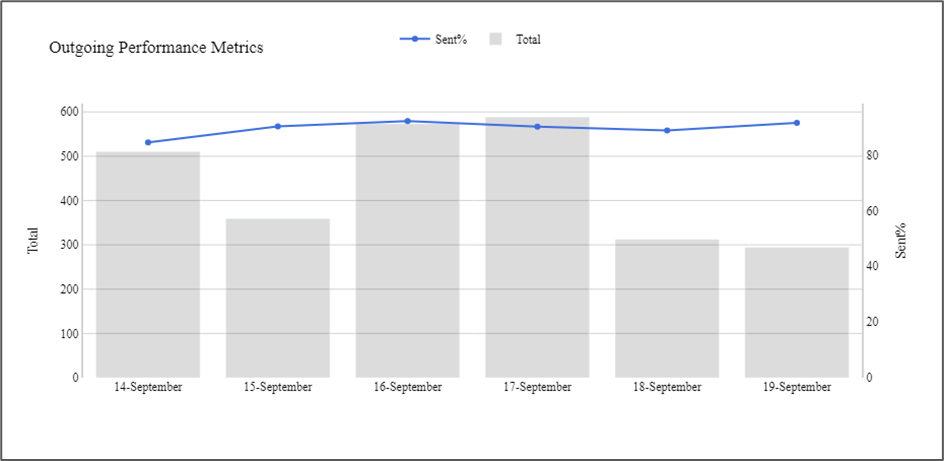
Total vs Sent%
These metrics provide insights into the total number of messages sent from the Wisely represented by horizontal grey colour bars and the sent percentage represented by blue lines over several days. When you hover over each bar, you can see the total number of messages sent and the total number of messages sent successfully without errors per day.
Delivery vs Read%
These metrics provide insights into the total number of messages delivered to the customers represented by horizontal grey colour bars and the read percentage represented by blue lines over several days. When you hover over each bar, you can see the total number of messages delivered to the customers and the total number of messages opened by the customers per day.
Outgoing Summary
This section shows the three reports, each report contains different metrics that enable you to gain deeper insights.
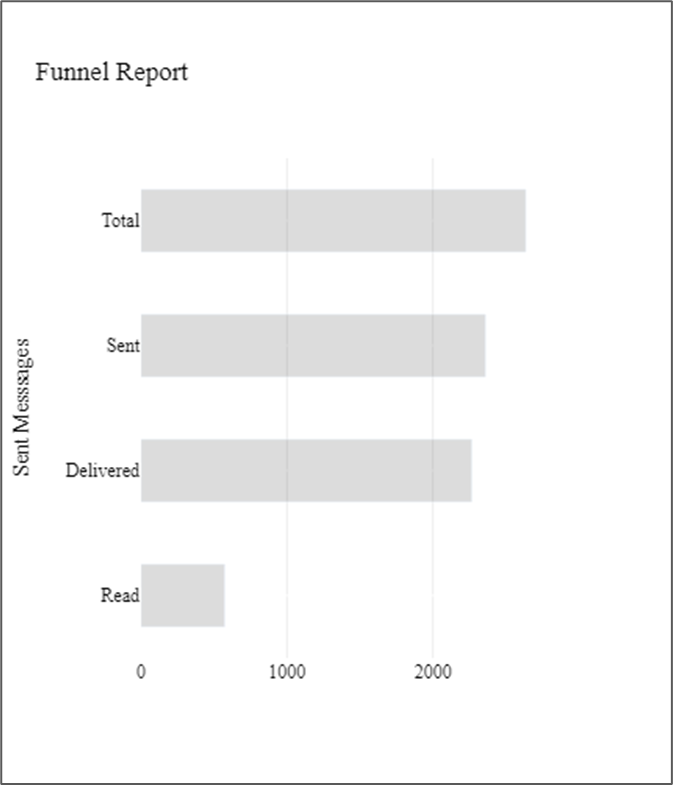
Funnel Report
This chart provides metrics, such as the total number of messages deployed from Wisely, the total number of messages successfully sent, the total number of messages reached to the customers, and the total number of messages opened by the customers on inverted bars represented by grey colour.
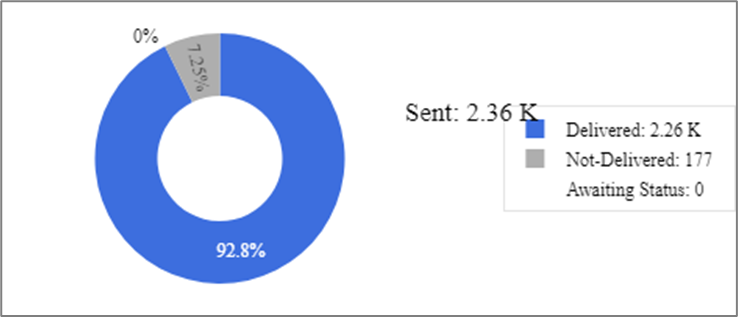
Sent Breakup
This section shows the Sent and Delivered messages on two doughnut charts, each chart consists of different metrics.
The Sent Donut chart consists of metrics, such as the total number of delivered represented by blue colour, the total number of messages not delivered represented by grey colour, and the yet to receive status from Wisely represented by white colour.
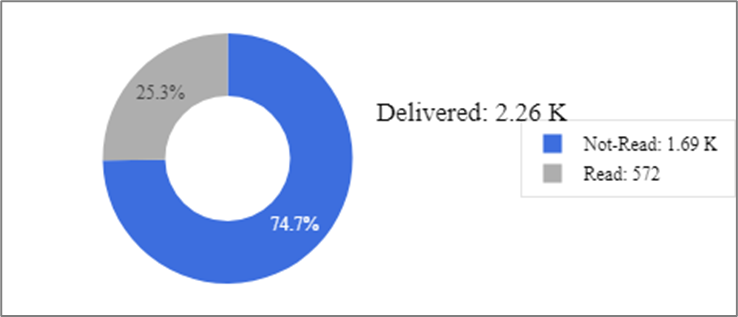
The Delivered Donut chart consists of metrics, such as the total number of messages read and not read by the customers.
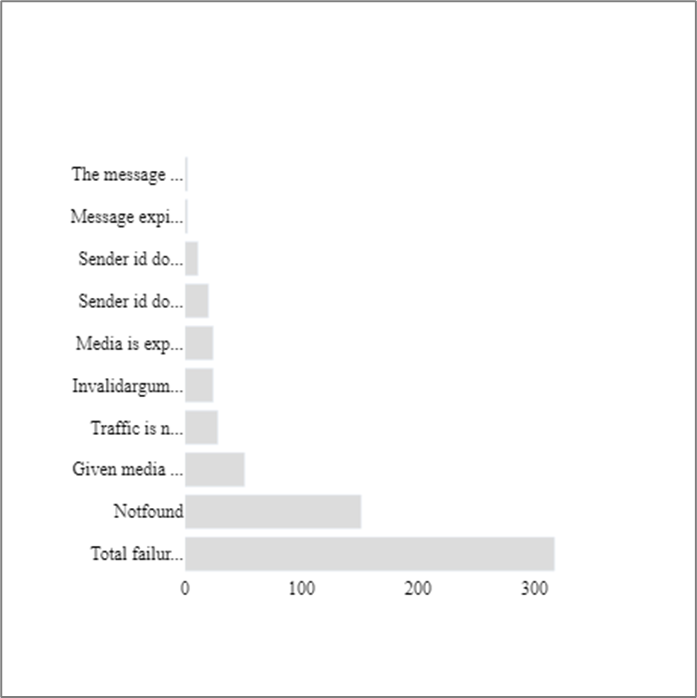
Failure Breakup
This horizontal bar chart shows the message delivery failure reasons and the total number of occurrences for each reason represented by grey colour bars. You can magnify each bar to delve into more details for each reason.
Detailed Summary
This tab consists of multiple tabs, each tab shows the metrics, such as the total number of outgoing messages and the total number of incoming messages. You can filter the data in each tab by date and download it in CSV format to share with others. The tabs given under this section vary from channel to channel.
The following tabs belong to the WhatsApp channel.
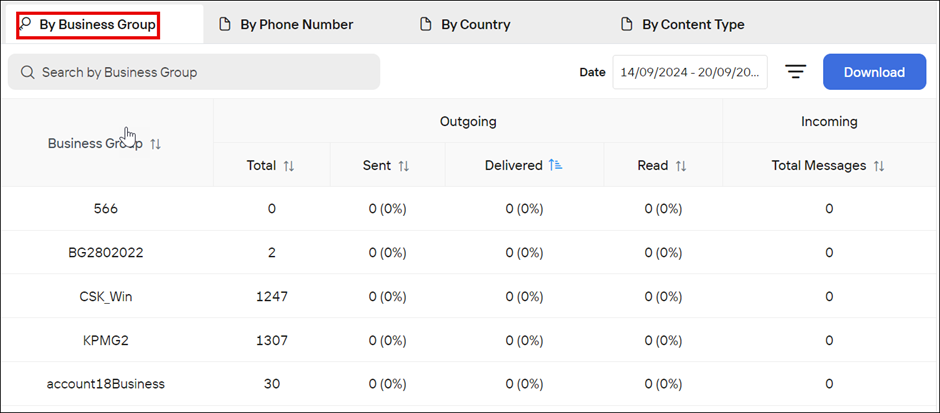
By Business Group
This tab shows the total number of outgoing messages and the total number of incoming messages for each business group.
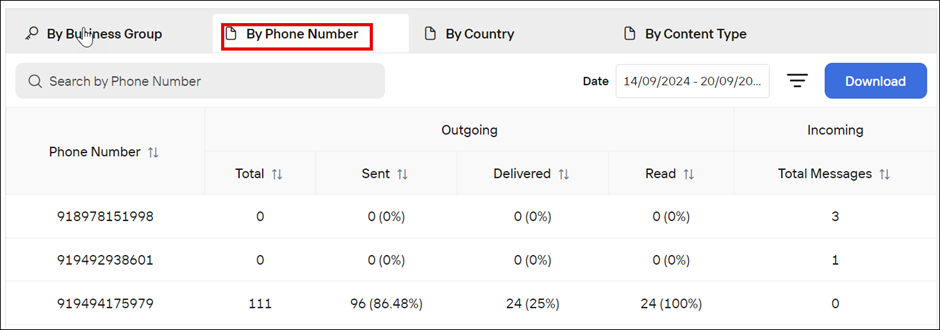
By Phone Number
This tab shows the total number of outgoing messages and the total number of incoming messages for each phone number.
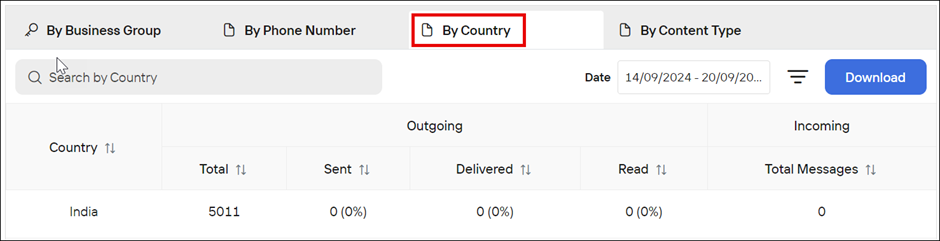
By Country
This tab shows the total number of outgoing messages and total number of incoming messages for each country.
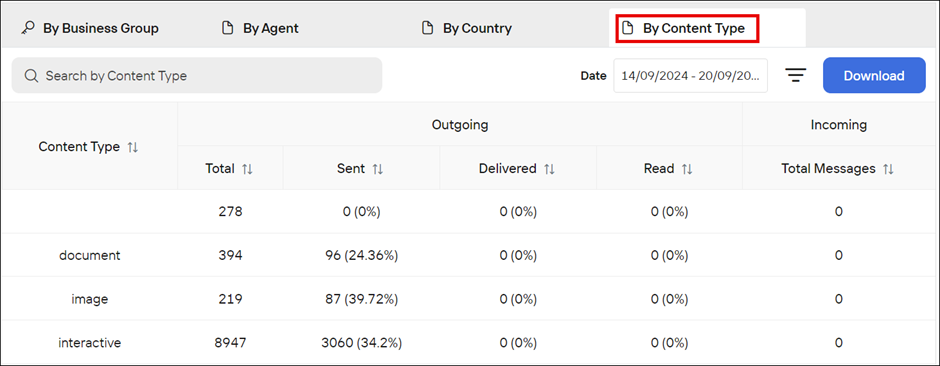
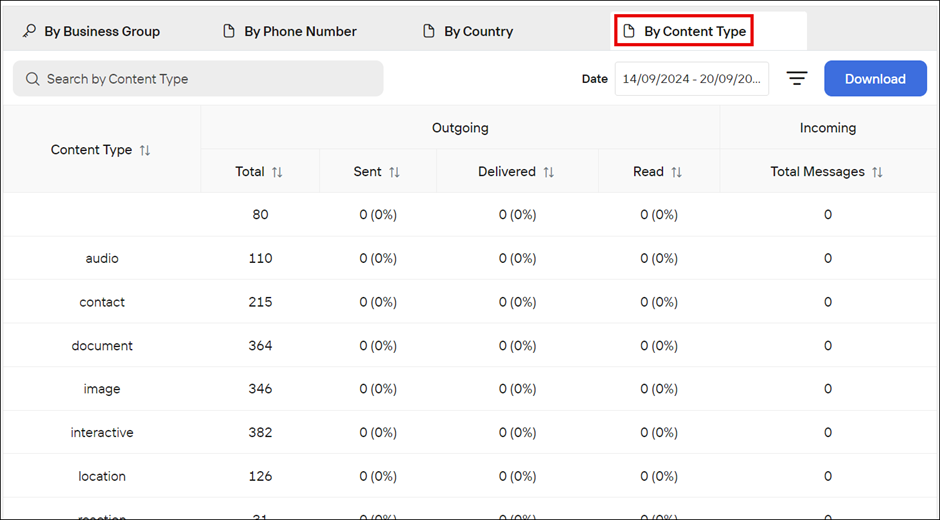
By Content type
This tab shows the total number of outgoing messages and the total number of incoming messages for each content type, such as image, document, text, contact, location etc.
Truecaller
The following tabs belong to the Truecaller channel.
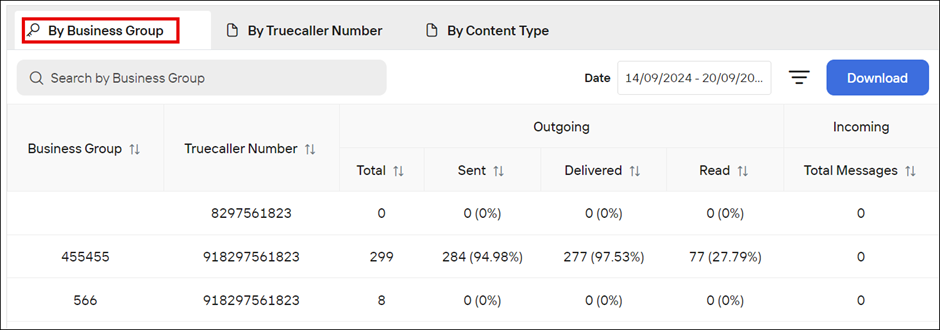
By Business Group
This tab shows the total number of outgoing messages and the total number of incoming messages for each business group.
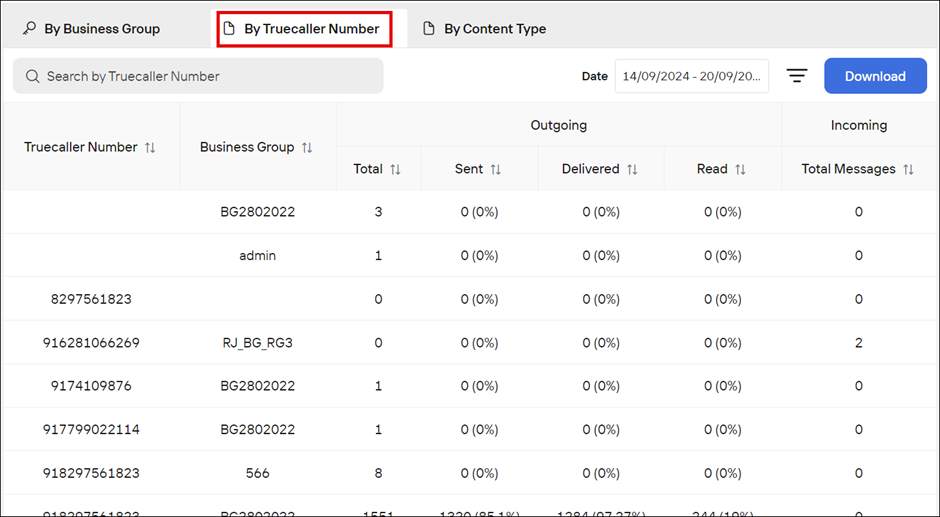
By Truecaller Number
This tab shows the total number of outgoing messages and the total number of incoming messages for each truecaller number.
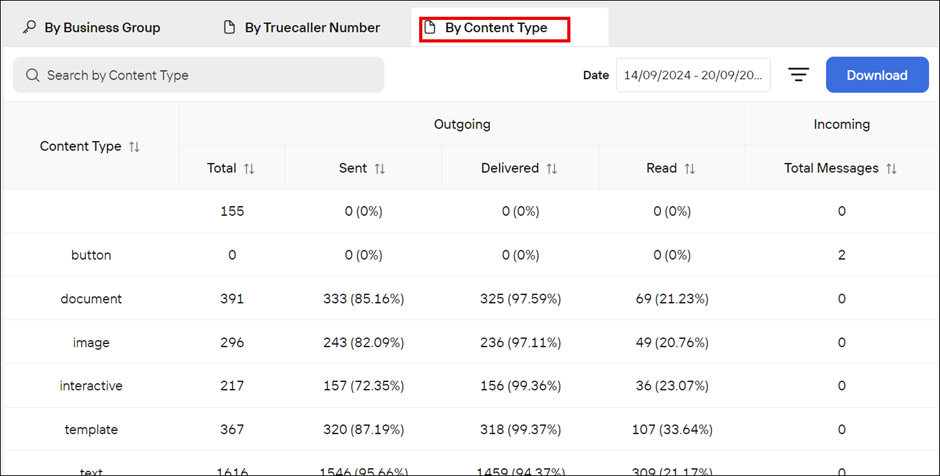
By Content type
This tab shows the total number of outgoing messages and the total number of incoming messages for each content type, such as image, document, text, contact, etc...
SMS
The following tabs belong to the SMS channel.
By Business Group
This tab shows the total number of outgoing messages for each business group.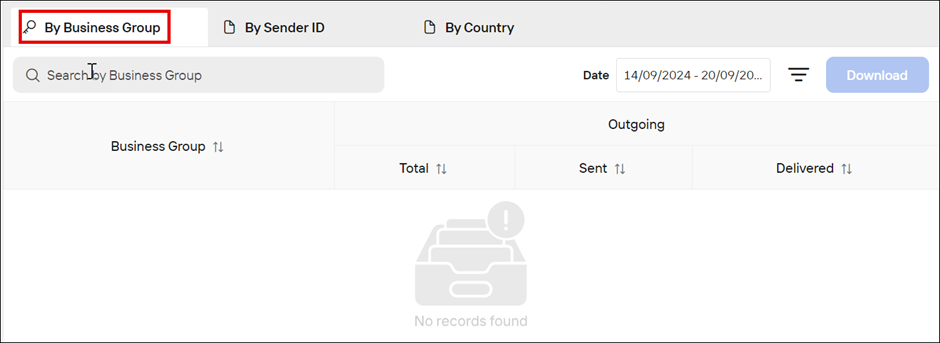
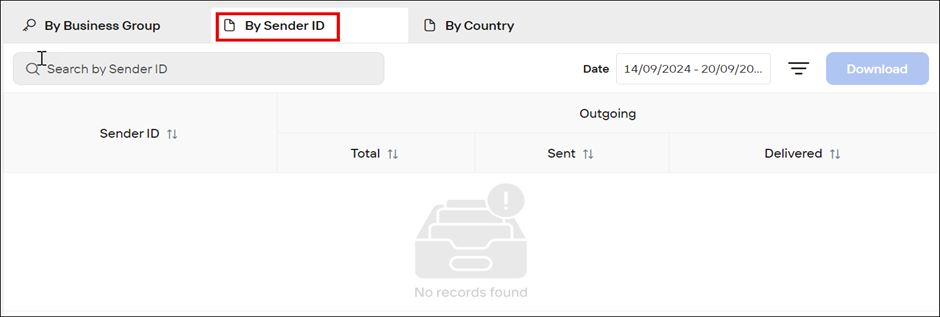
By Sender ID
This tab shows the total number of outgoing messages for each sender ID.
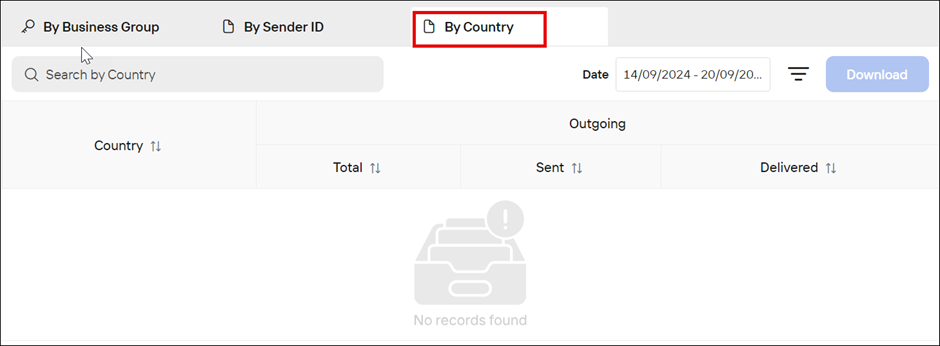
By Country
This tab shows the total number of outgoing messages for each country.
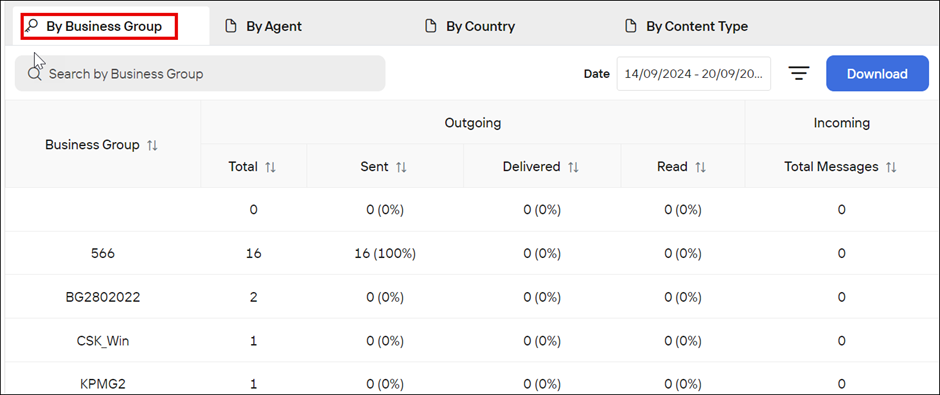
RCS
The following tabs belong to the Truecaller channel.
By Business Group
This tab shows the total number of outgoing messages and the total number of incoming messages for each business group.
By Agent
This tab shows the total number of outgoing messages and the total number of incoming messages for each agent ID.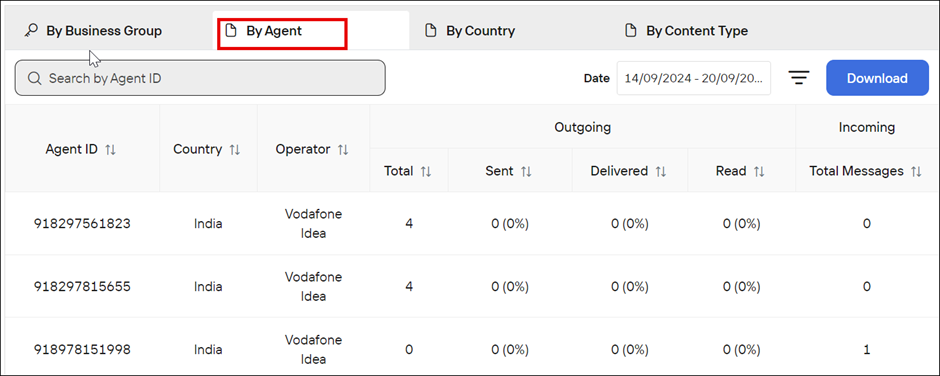
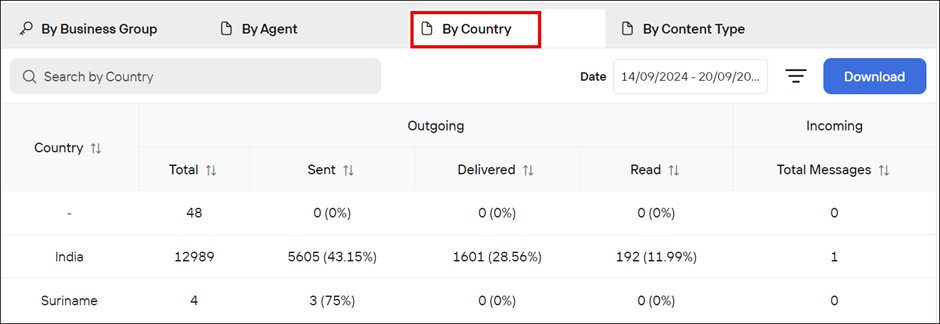
By Country
This tab shows the total number of outgoing messages and total number of incoming messages for each country.
By Content type
This tab shows the total number of outgoing messages and the total number of incoming messages for each content type, such as image, document, text, contact, etc.