Overview
The dashboard is the default page you see when you login to the Wisely platform every time. The analytical dashboard provides you with the historical data of all channels including WhatsApp, SMS, Truecaller, and RCS for the last 35 days. This data helps you figure out the performance of each channel and identify areas of improvement.
The dashboard consists of the following sections, which include:
Overall Performance
Types of traffic
Breakdown by Business Group
Overall Performance
This chart provides you with the key metrics on total traffic, sent rate, read rate, and delivery rate to track effectiveness of your campaign messages.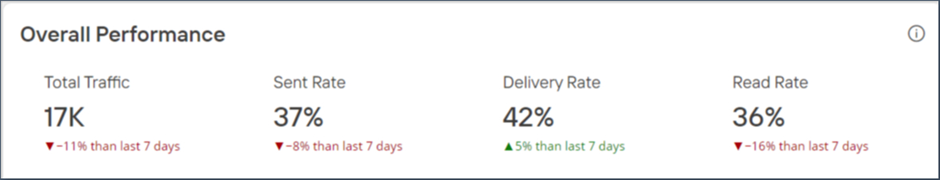
Metric | Description |
|---|---|
Total Traffic | Total volume of messages sent by the enterprise during a campaign. |
Sent Rate | Indicates the total number of messages sent to customers successfully out of total messages. |
Delivery Rate | Indicates how many messages reached the recipient’s inbox out of total sent messages. |
Read Rate | Indicates how many customers opened the message out of total delivered messages. |
Types of Traffic
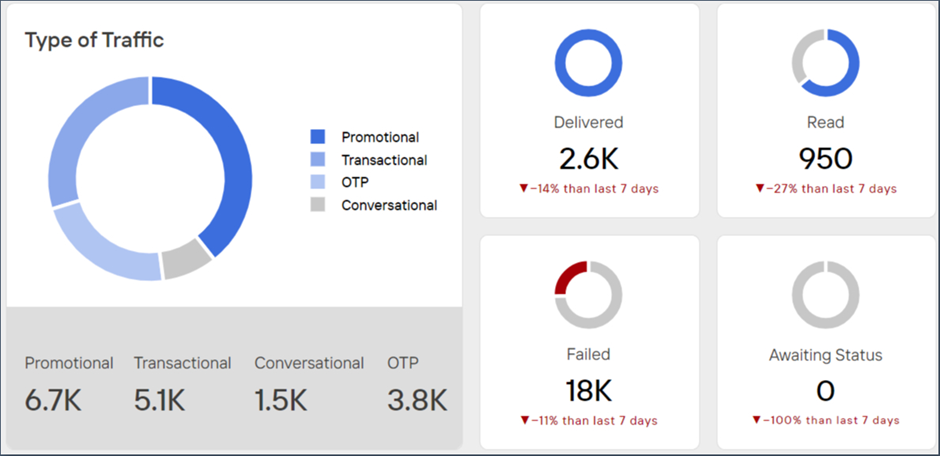
This chart shows the total traffic is classified as promotional, OTP, transactional, and conversational types with their respective counts. This chart also shows the key metrics including delivered, read, failed, and awaiting status for all types of messages.
Metric | Description |
|---|---|
Delivered | Indicates the total number of messages that reached the customer. |
Read | Indicates the total number of messages opened by the customers. |
Failed | Indicates how many messages failed to reach the customer. |
Awaiting Status | Refers to messages that have been scheduled or queued but have not yet been processed or sent to recipients. |
Breakdown by Business Group
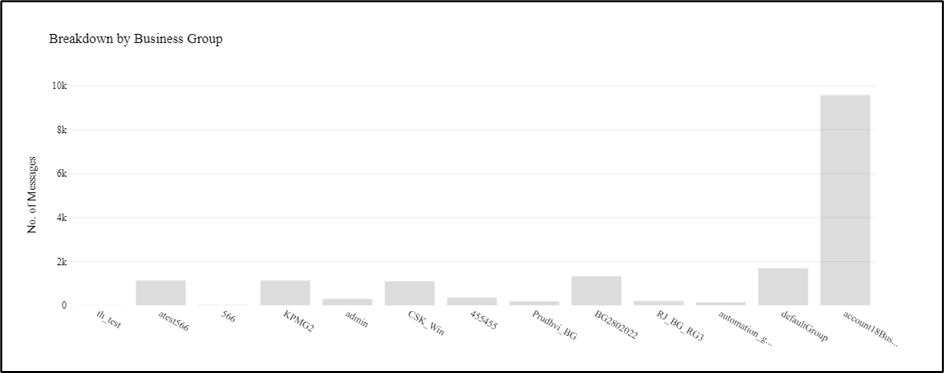
This bar chart shows the total number of messages sent to recipients for each business group within the enterprise. You can magnify each or combination of business group metrics on the chart to compare the values of one business group to the other.
Filter a Dashboard
You can filter the dashboard by date and messaging channel types.
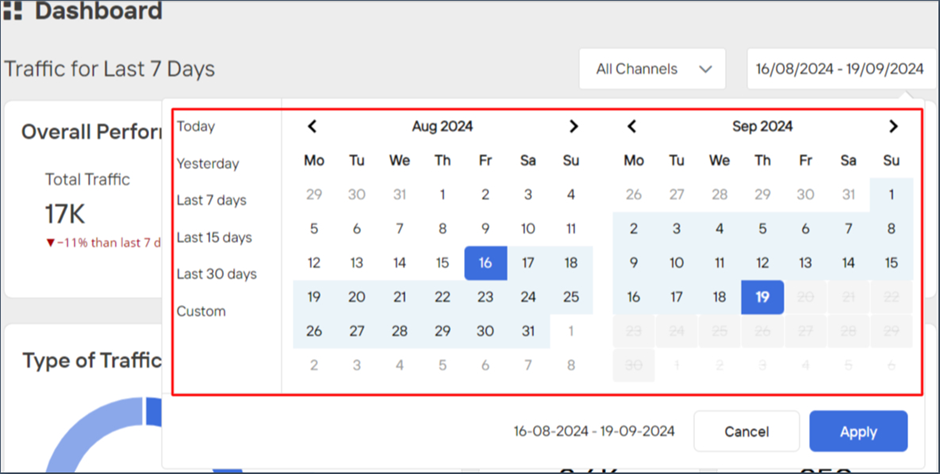
Filter by date
By default, dashboard values are set to last 7 days. However, you can filter them up to a maximum of 35 days in addition to the time periods, such as today, yesterday, last 7 days, last 15 days, last 30 days, and custom.
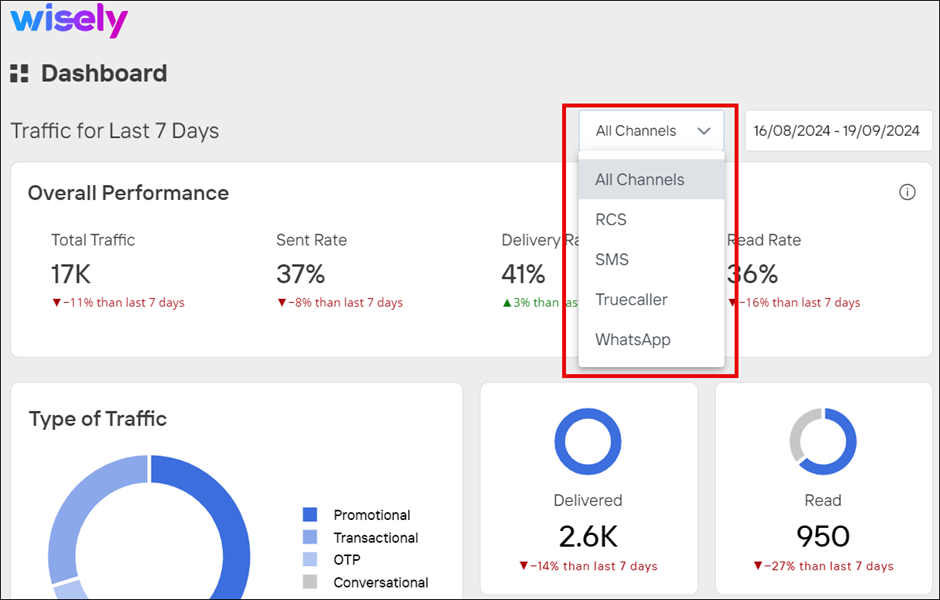
Filter by Channels
By default, dashboard values are shown for all channels. However, you can filter them by each channel and the values are filtered according to the channel type you select in the dashboard.